2019年25月18日雅思真题,数据体现出来的事实该怎么描述?
今天的主题是“描述数据体现出来的事实”。
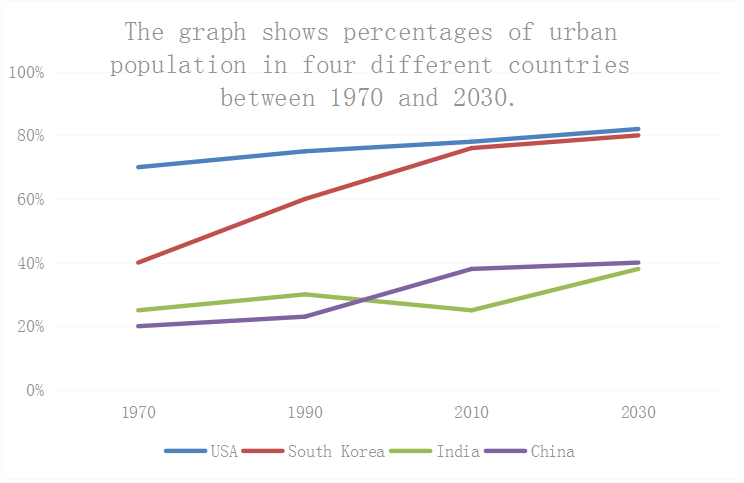
先看一下2019年5月18日的考题:2019年5月18日雅思小作文题目
国内(A类):折线图

高分范文及解析
以美国和韩国的那两条线为例。这样写:
America’s urban population has gradually grown to 80 percent, and it is forecast to grow further and slowly to 82 percent. In South Korea, the early 40-year period witnessed a surge from 40 percent to 76 percent. Since 2010, the growth has been sluggish, and, by 2030, the urban population is projected to account for 80 percent of the country’s total population.
真的就好了么?
是不是慌了?
应该的。因为那是属于“机械描述数据”的水平(当然,你能掌握就已经很值得表扬了)。
其实,“描述数据体现出来的事实”才是高能(高分)。
同样是这两条线,理想的写法是这样的:
Although South Korea started at a relatively low level (40 percent), the country kept catching up with the US at a rapid rate and achieved the same high level of urbanization (nearly 80 percent) in 2010, whereas the US, during the same 40-year period, saw a slow growth in the percentage of urban population. Aneck-and-neck situation has since been witnessed, and a continuation is anticipated.
发现了区别没有?
主要的区别在于对于数据的描述不是那么直接的写成“某某数值如何上涨”,而是写出一种“事件感”。这种“事件感”就是“描述数据体现出来的事实”。
我们再以《胡敏雅思第七代教材(高能版)》Page 95的表格里的部分信息为例,体会“描述数据体现出来的事实” (describe what the statistics represent / indicate) 这个“高能”写法:
The four countries’ travelers are most likely to drive and least likely to cycle. However, the Netherlands is an exception in the use of bicycles, as cycling is a popular means of transport just after driving, making roughly a quarter of all trips. The country is also noticeable for cars, the chief means of traveling, makes barely half of people’s journeys. In addition, Americans’ heavy reliance on cars is also noteworthy, since as many as 90 percent of journeys are made by car.
是不是没有“用机械无聊的方式说出这个数字是多少那个数字是多少”?那叫“机械描述数据”(当然,如果你的机械描述看起来“熟练准确高效且有多样的语法和词汇”,分数也会不错)。
如果,至此,你觉得“描述数据体现出来的事实”,那你可能需要一个措辞简单却仍然是描述数据体现出来的事实这个行文思路的版本。
当然可以有,下一次“支招小作文”时,给各位烤鸭看看。
雅思快讯
- 雅思口语Part 2:手机落在... 2022-08-21
- 雅思词汇解析 | 动物话题... 2022-07-21
- 雅思长难句解析 | 长难句 ... 2022-07-21
- 支招雅思小作文 | 家庭各... 2022-16-18
- 雅思听力单选题答题技巧有... 2022-11-18


